Dashboard templates reference
See exactly what the EDO Dashboard and Site Selector Dashboard templates contain, chart by chart, which account type sees which, and what happens to a dashboard after you create it from one.
Before you start
- Dashboards appears in the sidebar when your account's plan includes the Dashboards module. Templates are part of the Dashboards 2.0 experience, which Incenti turns on per account and which is off by default — see Classic dashboards if your Dashboards page opens a single embedded dashboard instead.
- This page is a reference for what's inside each template. For the steps to create a dashboard from one, see Create a dashboard from a template.
How templates work
A template is a starter dashboard Incenti maintains. Creating a dashboard from one copies every chart into your account — it doesn't link to the template. Two consequences:
- Changes Incenti later makes to a template never appear on a dashboard you've already created from it.
- Everything you change afterwards — renaming charts, reordering the grid, adding filters, deleting charts you don't need — stays yours and never touches the template.
Every chart runs against your own account's live data from the moment the dashboard is created. The sample numbers in the gallery preview are generated placeholders and are never used again after that.
Which template you see
Each template is published to one account type, and the gallery lists only the ones matching yours. An EDO account sees the EDO Dashboard template; a site selector account sees the Site Selector Dashboard template. Neither ever sees the other's, so seeing exactly one template in the gallery is expected.
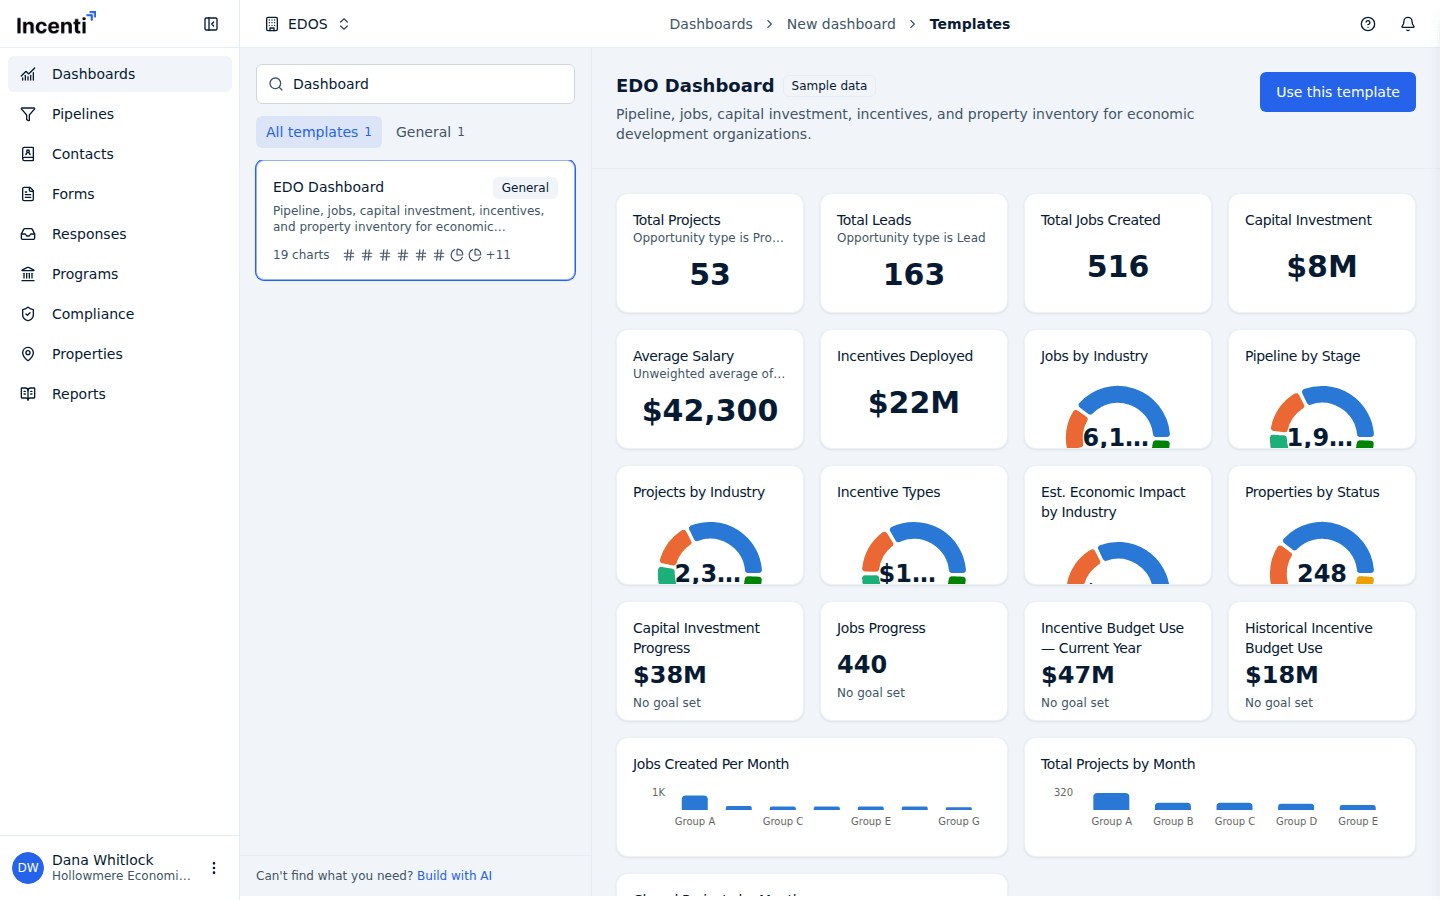
What's in the EDO Dashboard template
Nineteen charts covering pipeline, jobs, capital investment, incentives, and property inventory.
| Chart | Type | What it measures |
|---|---|---|
| Total Projects | Stat | Opportunities whose type is PROJECT |
| Total Leads | Stat | Opportunities whose type is LEAD |
| Total Jobs Created | Stat | Total jobs summed across every opportunity |
| Capital Investment | Stat | Total capital investment summed across every opportunity |
| Average Salary | Stat | Average salary averaged across opportunities |
| Incentives Deployed | Stat | Amount awarded summed across incentive awards |
| Jobs by Industry | Donut | Total jobs summed, split by industry |
| Pipeline by Stage | Donut | Opportunities counted, split by pipeline stage |
| Projects by Industry | Donut | Opportunities counted, split by industry |
| Incentive Types | Donut | Amount awarded summed, split by incentive type |
| Est. Economic Impact by Industry | Donut | Estimated economic impact summed, split by industry |
| Properties by Status | Donut | Properties counted, split by status |
| Capital Investment Progress | Progress | Total capital investment against a goal you set |
| Jobs Progress | Progress | Total jobs against a goal you set |
| Incentive Budget Use — Current Year | Progress | Amount awarded year to date, against a budget you set |
| Historical Incentive Budget Use | Progress | Amount awarded all-time, against a budget you set |
| Jobs Created Per Month | Bar | Total jobs summed by month, last 12 months |
| Total Projects by Month | Bar | Opportunities counted by month, last 12 months |
| Closed Projects by Month | Bar | Won opportunities counted by month, last 12 months |
Money charts are formatted as currency with no decimal places. Total Projects by Month counts every opportunity created in the month, not only those typed as PROJECT.
What's in the Site Selector Dashboard template
Eight charts covering project and lead pipeline alongside available property inventory. It's shorter than the EDO template because it only includes charts backed by data a site selection firm actually keeps.
| Chart | Type | What it measures |
|---|---|---|
| Total Projects | Stat | Opportunities whose type is PROJECT |
| Total Leads | Stat | Contacts in your CRM |
| Total Available Acres | Stat | Available acres summed across properties, shown in acres |
| Total Square Footage | Stat | Building square footage summed, shown in sq ft |
| Total Projects by Type | Donut | Opportunities counted, split by opportunity type |
| Leads by Stage | Donut | Lead opportunities counted, split by pipeline stage |
| Square Footage by Property Type | Donut | Building square footage summed, split by property type |
| Markets of Origin | Donut | Contacts counted, split by the country of their address |
Total Leads here counts contacts, not opportunities typed as LEAD — a deliberate difference from the EDO template's card of the same name. Rename or repoint it after creating your dashboard if that isn't what you want.
After you create the dashboard
- Progress charts start with no goal. The four Progress charts in the EDO template ship without a target, so each shows its number with a muted "No goal set" note instead of a bar. Open the chart's ⋯ menu, choose Edit chart, and set a Goal (and Goal label) under Display options to get the bar and the percentage.
- A chart with no data reads "No data to display." That's normal on a new account — for example Properties by Status before you've added any properties, or the incentive charts before Compliance has any awards. The chart starts working as soon as the records exist.
- Nothing is locked. Rename the dashboard, reorder and resize charts, delete ones you don't use, add filters, or ask the dashboard's AI chat for something new. See Edit a dashboard.
Common questions
Q: Which charts are in my template? A: See the two tables above — 19 charts for the EDO Dashboard template and 8 for the Site Selector Dashboard template. Your account type decides which one you're offered.
Q: Incenti updated a template — will my dashboard get the new charts? A: No. A dashboard is a one-time copy of the template, so later template changes never reach it. Create a second dashboard from the updated template if you want the newer version, then delete the old one once you're happy.
Q: Why do my Progress charts show "No goal set" instead of a bar? A: Templates ship without targets, because a sensible goal is specific to your organization. Edit each Progress chart and set a Goal value under Display options.
Q: Can I get the other account type's template? A: Not from the gallery — templates are published per account type. Build the charts you want manually or ask the dashboard's AI chat for them instead.
Related
Last updated on