Chart fields reference
Every field each dashboard data source offers — what you can group by, filter on, and aggregate, the exact values of each list field, which dates a date range can use, and whether drill-down rows open a record.
Before you start
- Dashboards appears in the sidebar when your account's plan includes the Dashboards module. The chart builder this page describes is part of the Dashboards 2.0 experience, which Incenti turns on per account and which is off by default — see Classic dashboards if your Dashboards page opens a single embedded dashboard instead.
- This is a lookup page for the Add chart and Edit chart dialogs. For the click-by-click steps, see Edit a dashboard.
- Three things a field can be used for: group by (the categories a bar, slice, line point, or table row stands for), filter (narrowing which records count), and aggregate (the number a Sum, Average, Min, or Max measure is taken over). Count needs no field at all, so every source can be counted.
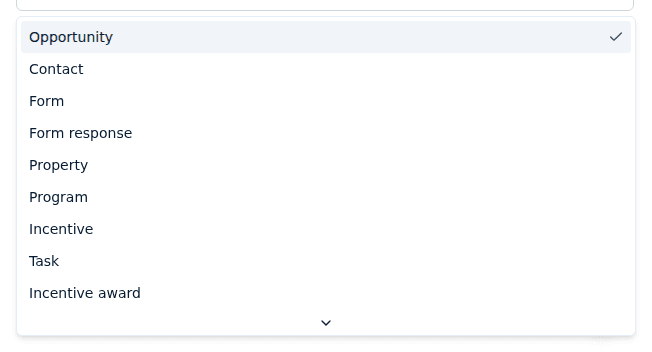
Opportunity
Projects, leads, and RFIs in your pipeline. Drill-down rows open the opportunity.
| Field | Use it for | Values |
|---|---|---|
| Opportunity type | Group by, filter | LEAD, RFI, PROJECT |
| Status | Group by, filter | your pipeline's status labels |
| Status category | Group by, filter | ACTIVE, INACTIVE, CLOSED |
| Pipeline | Group by, filter | your pipeline names |
| Pipeline stage | Group by, filter | your stage labels |
| Won/lost outcome | Group by, filter | WON, LOST |
| Industry | Group by, filter | your industry names |
| Total jobs | Aggregate, filter | number |
| Total capital investment | Aggregate, filter | number |
| Average salary | Aggregate, filter | number |
| Estimated economic impact | Aggregate, filter | number |
| Start date, End date, Created | Group by, filter, date range | date |
Date range can use Start date, End date, or Created; Created is the default. Averaging Average salary averages each opportunity's own average, unweighted by how many jobs each one has.
Industry is a to-many field: an opportunity listed in three industries counts once toward each of them, so grouping by industry can total more than your opportunity count.
Contact
People in your CRM. Drill-down rows open the contact. There are no numeric fields, so charts here are counts.
| Field | Use it for | Values |
|---|---|---|
| Status | Group by, filter | PENDING, APPROVED, REJECTED |
| Filter only | text | |
| Title | Group by, filter | text |
| Country | Group by, filter | country names from addresses |
| Created | Group by, filter, date range | date |
Date range uses Created. Country comes from the contact's addresses and is a to-many field: a contact with addresses in two countries counts toward each.
Form
Forms your account has created. Drill-down rows open the form. There are no numeric fields, so charts here are counts.
| Field | Use it for | Values |
|---|---|---|
| Status | Group by, filter | DRAFT, ACTIVE, CLOSED |
| Form type | Group by, filter | your form type names |
| Created | Group by, filter, date range | date |
| Expires | Filter, date range | date |
| Closed | Filter, date range | date |
Date range can use Created (the default), Expires, or Closed. The hidden one-off forms created when someone uploads a document to start a response are left out of this source, the same way they're left out of the Forms list.
Form response
Submissions of your forms. Drill-down rows open the response, and the drill-down dialog offers Open in Responses. There are no numeric fields, so charts here are counts.
| Field | Use it for | Values |
|---|---|---|
| Status | Group by, filter | PENDING, IN_PROGRESS, READY_FOR_SUBMISSION, SUBMITTED, IN_REVIEW, DECLINED, APPROVED, SHORTLISTED, STALE |
| Form | Group by, filter | your form titles |
| Respondent domain | Group by, filter | the email domain a response came from |
| Submitted | Group by, filter, date range | date |
| Created | Group by, filter, date range | date |
Date range can use Submitted or Created; Created is the default. Respondent domain is handy for seeing which organizations are responding without listing individual people.
Property
Sites and buildings in your inventory. Property records have no detail page of their own, so drill-down rows here are read-only.
| Field | Use it for | Values |
|---|---|---|
| Type | Group by, filter | SITE, BUILDING, SITE_AND_BUILDING |
| Status | Group by, filter | AVAILABLE, UNDER_OPTION, UNDER_CONTRACT, SOLD |
| For sale, For lease | Group by, filter | True or False |
| City, State, County | Group by, filter | text (State is a two-letter code) |
| Available acres | Aggregate, filter | number |
| Total acres | Aggregate, filter | number |
| Sale price | Aggregate, filter | number |
| Building square footage | Aggregate only | number |
| Created | Group by, filter, date range | date |
Date range uses Created. Building square footage can be summed or averaged but can't be filtered on or grouped by.
Program
Your incentive programs. Drill-down rows open the program.
| Field | Use it for | Values |
|---|---|---|
| Designation | Group by, filter | LOCAL, STATE, FEDERAL |
| Status | Group by, filter | DRAFT, ACTIVE, INACTIVE, ARCHIVED |
| Geographic focus | Group by, filter | LOCAL, REGIONAL, STATEWIDE, NATIONAL |
| Program type | Group by, filter | your program type names |
| Provider | Group by, filter | your provider names |
| Total budget approved | Aggregate, filter | number |
| Start date, End date | Filter, date range | date |
| Created | Group by, filter, date range | date |
Date range can use Start date, End date, or Created; Created is the default.
Incentive
Individual incentives defined under your programs. Incentives have no detail page of their own, so drill-down rows here are read-only.
| Field | Use it for | Values |
|---|---|---|
| Incentive type | Group by, filter | your incentive type names |
| Program | Group by, filter | your program names |
| Budget | Aggregate, filter | number |
| Allocated amount | Aggregate, filter | number |
| Created | Group by, filter, date range | date |
Date range uses Created. Pair Allocated amount with Budget on a Progress chart to show how much of a budget is committed.
Task
Tasks on your opportunities. Tasks have no detail page of their own, so drill-down rows here are read-only.
| Field | Use it for | Values |
|---|---|---|
| Status | Group by, filter | PENDING, IN_PROGRESS, COMPLETED, ABANDONED |
| Priority | Group by, filter | LOW, MEDIUM, HIGH |
| Automated | Group by, filter | True or False |
| Due date | Group by, filter, date range | date |
| Created | Group by, filter, date range | date |
Date range can use Due date or Created; Created is the default. Automated tells apart tasks a pipeline created for you from ones someone added by hand.
Incentive award
Awarded incentives tracked by the Compliance module. Drill-down rows open the award in Compliance.
| Field | Use it for | Values |
|---|---|---|
| Incentive type | Group by, filter | your incentive type names |
| Program | Group by, filter | your program names |
| Organization name | Group by, filter | text |
| City, State/province, County | Group by, filter | text |
| Amount awarded | Aggregate, filter | number |
| Amount received | Aggregate, filter | number |
| Start date, Created | Group by, filter, date range | date |
| End date | Filter, date range | date |
Date range can use Start date, End date, or Created — and unlike every other source, Start date is the default, since an award's own start is usually what you want to report on. Amount awarded versus Amount received is the gap between what was committed and what has actually been paid.
Metric
Values recorded through the Metrics feature. A metric value belongs to whatever it was recorded on — a project, a form response, a contact, or a contact group — so there's no single record to open and drill-down rows here are read-only.
| Field | Use it for | Values |
|---|---|---|
| Metric | Group by, filter | your metric names |
| Metric key | Group by, filter | your metric keys |
| Entity type | Group by, filter | PROJECT, FORM_RESPONSE, CONTACT, CONTACT_GROUP |
| Value | Aggregate only | number |
| Value (text) | Filter only | text |
| First recorded | Group by, filter, date range | date |
| Last updated | Group by, filter, date range | date |
Date range can use First recorded or Last updated; Last updated is the default. Summing or averaging Value requires scoping the chart to one metric — use the Tracked metric picker that appears once you choose this source, or filter/group by Metric or Metric key. Counting values needs no scoping. A value that isn't a plain number is left out of an aggregation rather than causing an error. See Metric definitions.
Filter operators and value pickers
Eight operators exist; the dropdown offers the ones that make sense for the field you picked.
| Operator | Means | Offered for |
|---|---|---|
| is | exactly equals the value | every kind of field |
| is not | anything except the value | text, number, yes/no, list |
| is any of | matches any value in a list you give | text, number, list |
| greater than | above the value | number, date |
| greater than or equal to | at or above the value | number, date |
| less than | below the value | number, date |
| less than or equal to | at or below the value | number, date |
| contains | the text appears anywhere in the value | text |
The value control changes to match the field:
- List field (one with fixed values, like Status category) — a dropdown of exactly those values. With is any of it becomes a Select values multi-select.
- Free text with is any of — a Comma-separated values box.
- Yes/no field — a True / False dropdown.
- Number — a number box. Date — a date picker.
Limits
- A chart returns at most 1,000 rows, whatever its Limit is set to. A chart that hits the cap prints "Showing the first 1,000 rows — refine the query to narrow results."
- Limit itself accepts 1 to 1,000 and defaults to 100.
- Decimals accepts 0 to 6.
- A Donut chart colours at most 8 categories and folds the rest into a single Other slice, which can't be drilled into.
- A dashboard can carry at most 10 filters, each Field filter holding at most 10 selected values, and an Account scope filter at most 50 accounts. See Filters and drill-down.
- A drill-down loads 100 records at a time and exports at most 10,000 rows to CSV.
- Every chart reads only your own account's records — no other account's data, and nothing from Insights.
Common questions
Q: Which fields can I actually sum or average? A: Opportunity (Total jobs, Total capital investment, Average salary, Estimated economic impact), Property (Available acres, Total acres, Sale price, Building square footage), Program (Total budget approved), Incentive (Budget, Allocated amount), Incentive award (Amount awarded, Amount received), and Metric (Value). Contact, Form, Form response, and Task have no numeric fields — chart them with Count.
Q: Why can't I group a chart by Building square footage or by a contact's email? A: Some fields are deliberately one-purpose. Building square footage can only be aggregated, and Email and Value (text) can only be filtered on. The dropdowns only list fields valid for the control you're in, so anything missing from a list isn't available for that use.
Q: Which date does a Date range apply to? A: Whichever you pick in the Date field control next to it. Left on Default, it uses the source's own default — Created for most sources, Start date for Incentive award, and Last updated for Metric.
Q: A drill-down row isn't a link — is something wrong? A: No. Property, Incentive, Task, and Metric records have no detail page in the portal, so their drill-down rows are read-only. Opportunity, Contact, Form, Form response, and Program rows open the record, and Incentive award rows open the award in Compliance.
Related
Last updated on