Build a Fiscal Impact Analysis report
Enter tax rates, property values, and spending assumptions into a Fiscal Impact Analysis report to estimate the new annual property and sales tax a redevelopment would generate.
Before you start
- You need a report of type Fiscal Impact Analysis (see Create and manage reports).
- Have ready: local tax rates for the property (city, county, school, state, or however your jurisdiction breaks them out); current fair market value and planned renovation/construction for the current, commercial/retail, and residential scenarios; new housing unit count and median household income; local consumer spending figures and the local option sales tax rate; and square footage plus expected sales per square foot for any retail categories in the project.
Steps
The cards run down the page in this order. There's no Save button — the report auto-saves about a second after you stop typing, and the Timeline card's Last Updated time moves to confirm it. See When the report actually saves below: a few fields on their own aren't enough to trigger a save.
Set the tax rates
-
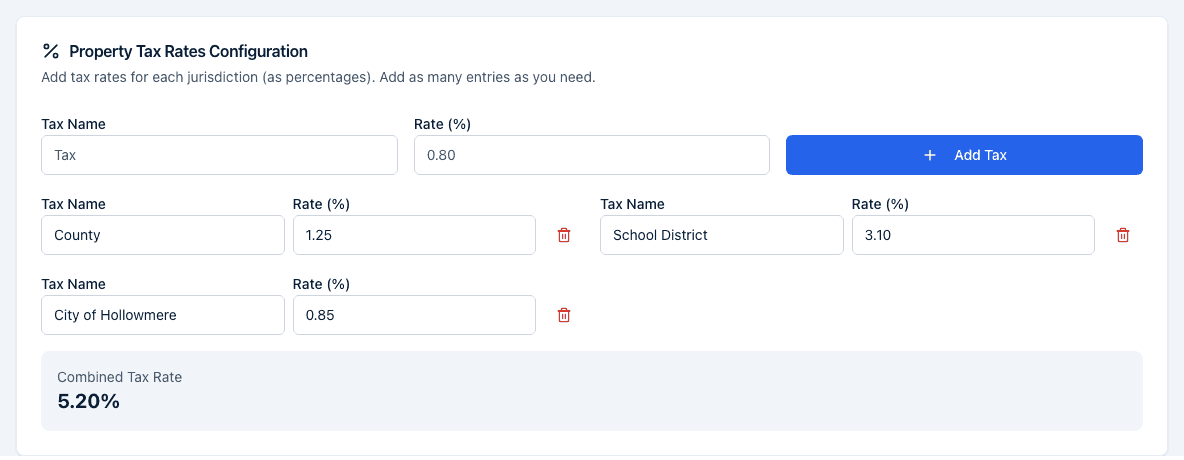
In Property Tax Rates Configuration, enter a Tax Name and Rate (%) for each jurisdiction, then click Add Tax — one entry per jurisdiction (for example, city, county, school, state). Edit or remove a row with the trash icon. The footer shows the Combined Tax Rate, the sum of every rate entered.
Enter the project costs
-
In Estimated Project Costs (Proposed), fill in Current Fair Market Value ($) and Renovation/Construction ($) for each of the three blocks: Current Property, Commercial/Retail Property, and Residential Property. Each block shows a read-only Annual Tax that updates as you type.
-
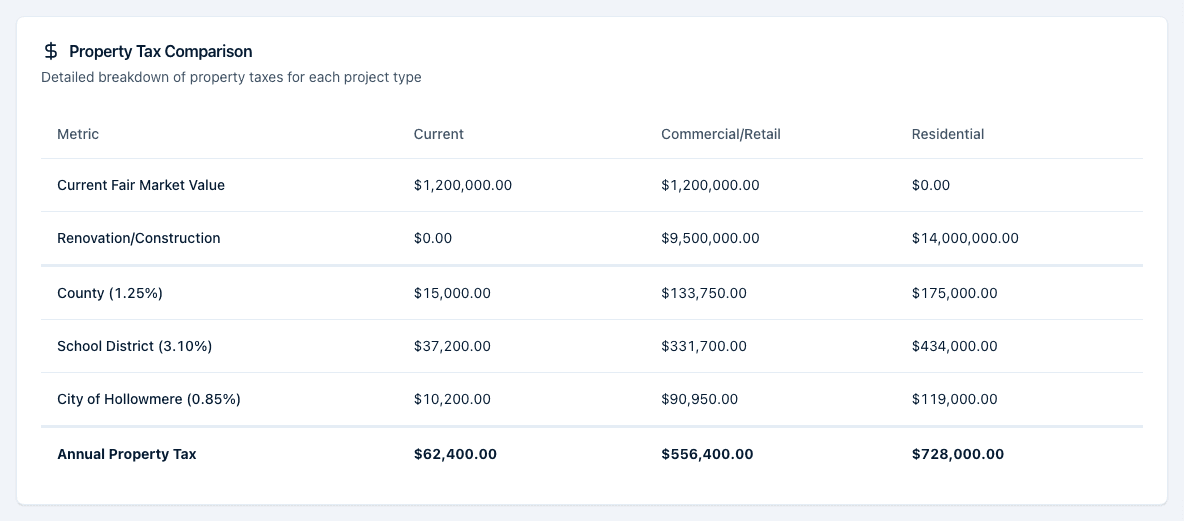
The Property Tax Comparison table below lines up the Current, Commercial/Retail, and Residential columns: Fair Market Value, Renovation/Construction, one row per tax you configured, and a bolded Annual Property Tax total for each column.
Estimate household income and spend
- In Estimated New Household Income, enter the Number of New Units and Median Household Income ($). Once both are filled in, the card shows Median Household Income and New Household to Market (80%) — the units expected to be occupied.
- In Estimated Household Spend, enter Consumer Spending Report (excludes groceries) ($) and Local Option Sales Taxes (%). With the new-unit count also filled in, the card shows New Annual Sales Projection and New Annual Local Sales Tax Projection.
Estimate sales per square foot
- In Estimated Sales Per SF in the Project, enter a Category, SF, and Sales/SF* for each retail or commercial use, then click Add Entry. Each row shows its own New Taxable Sales; remove a row with the trash icon. The card totals to a New Annual Sales Projection Total and a New Annual Local Sales Tax Projection.
Read the fiscal impact summary
-
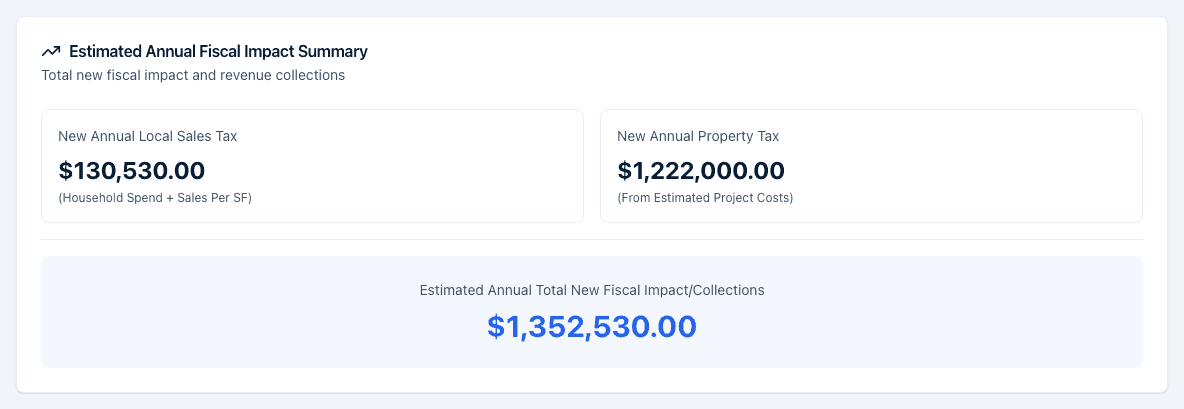
Once there's enough data, an Estimated Annual Fiscal Impact Summary card appears, showing New Annual Local Sales Tax, New Annual Property Tax, and a highlighted Estimated Annual Total New Fiscal Impact/Collections figure.
How the numbers are calculated
- Annual tax for a property block = (Fair Market Value + Renovation/ Construction) × Combined Tax Rate; each tax row is that total × just that jurisdiction's rate.
- New Household to Market = Number of New Units × 80%, rounded down.
- New Annual Sales (household spend) = New Household to Market × Consumer Spending Report; its sales tax = that × Local Option Sales Taxes.
- Taxable sales for a Sales Per SF row = SF × Sales/SF; the total across entries is taxed at the same rate.
- New Annual Local Sales Tax (summary) = household-spend sales tax + Sales Per SF sales tax.
- New Annual Property Tax (summary) = Commercial/Retail annual tax + Residential annual tax − Current annual tax, so it's often lower than the commercial and residential taxes simply added — the existing tax is subtracted out.
- Estimated Annual Total New Fiscal Impact/Collections = New Annual Local Sales Tax + New Annual Property Tax.
When the report actually saves
Autosave only runs once the report holds something worth saving. At least one of these has to be true:
- a tax rate above 0 in Property Tax Rates Configuration, or
- a project-cost block (Current, Commercial/Retail, or Residential) with a total above 0, or
- at least one row in Estimated Sales Per SF in the Project, or
- both Number of New Units and Median Household Income ($) filled in with values above 0.
Until one of those holds, nothing is written — so typing only the two Estimated Household Spend figures, or adding a tax row at rate 0, saves nothing and the report reopens empty. Add a tax rate or a project cost first and the rest of the page starts saving with it.
Two other things worth knowing while you fill the page in: the Estimated New Household Income card only shows its computed rows once both its fields are filled, and the three property scenarios (Current, Commercial/Retail, Residential) are fixed — you can't add a fourth.
What happens next
Changes auto-save about a second after you stop typing — there's no Save button — provided the report holds enough data to save (see above). Publishing the report (its first export) locks every field on this page, so check the figures before you export. See Publish and export a report.
Common questions
Q: Why is New Annual Property Tax lower than the Commercial and Residential annual tax added together? A: The summary subtracts the property's Current annual tax: New Annual Property Tax = Commercial annual tax + Residential annual tax − Current annual tax. That isolates the new tax the redevelopment creates, not the full commercial and residential totals.
Q: The summary card is not showing up. A: The Estimated Annual Fiscal Impact Summary card appears only once there's enough data — values in Estimated Project Costs, both Estimated Household Spend fields, or a row in Estimated Sales Per SF in the Project.
Q: Can I add a tax abatement or a phase-in period? A: Not as a separate field. To model a reduced or phased-in rate, lower the Rate (%) for that jurisdiction in Property Tax Rates Configuration to the effective rate during the abatement, then raise it again once the abatement ends.
Q: Why didn't my Estimated Household Spend numbers save? A: Those two fields alone don't start the autosave. Add a tax rate above 0, a project cost, a Sales Per SF row, or both new-household fields, and the whole page — including the household spend figures — saves together.
Q: What is "Transaction Basis Adjustment" in the CSV? A: It's the exported label for what the page calls Current Fair Market Value ($) — same number, different name. The CSV also prints a Total Project Cost row per scenario that the on-screen table doesn't show. See What's in an exported file for the whole list.
Q: Can I add more than three property scenarios? A: No. The report compares exactly three — Current, Commercial/Retail, and Residential. To model a fourth, create a second Fiscal Impact Analysis report.
Related
Last updated on