Build an Economic Impact report
Enter a project's timing, capital investments, and employment figures to see year-by-year jobs, payroll, and capital value projections.
Before you start
- You need a report of type Economic Impact (see Create and manage reports if you haven't created one yet).
- Have these figures ready: the project's start date and how many years to project; each planned capital investment with its dollar value and an expected annual growth factor; and retained and new job counts with their average wages and a wage growth rate.
An Economic Impact report estimates a project's jobs, payroll, and capital value over a number of years you choose, based entirely on the figures you enter. Nothing is pulled in for you — not from the project's own jobs and capital-investment fields in your pipeline, not from Insights, not from anywhere else. Every number on the page is one you typed.
Steps
Set the project timing
- Open the report and find the Project Timing card.
- Set Start Date (defaults to today) and Number of Years — the analysis horizon. Every table below only fills in once this is set to 1 or more.
Add capital investments
-
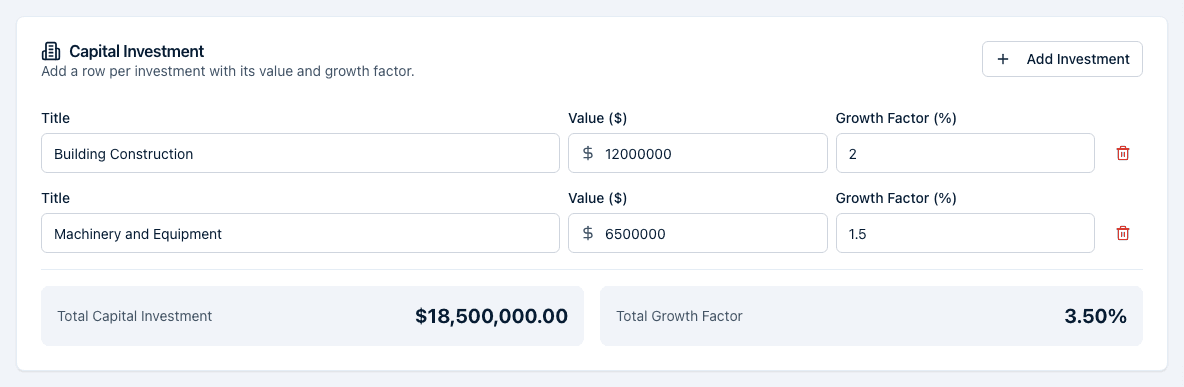
In the Capital Investment card, click Add Investment for each planned investment (building construction, equipment, and so on).
-
For each row, enter a Title, a Value ($), and a Growth Factor (%) — how much that investment's value is expected to grow each year.
-
Remove a row with the trash icon next to it.
-
The card footer shows Total Capital Investment (the sum of every row's value) and Total Growth Factor (the sum of every row's growth factor).
Enter employment figures
-
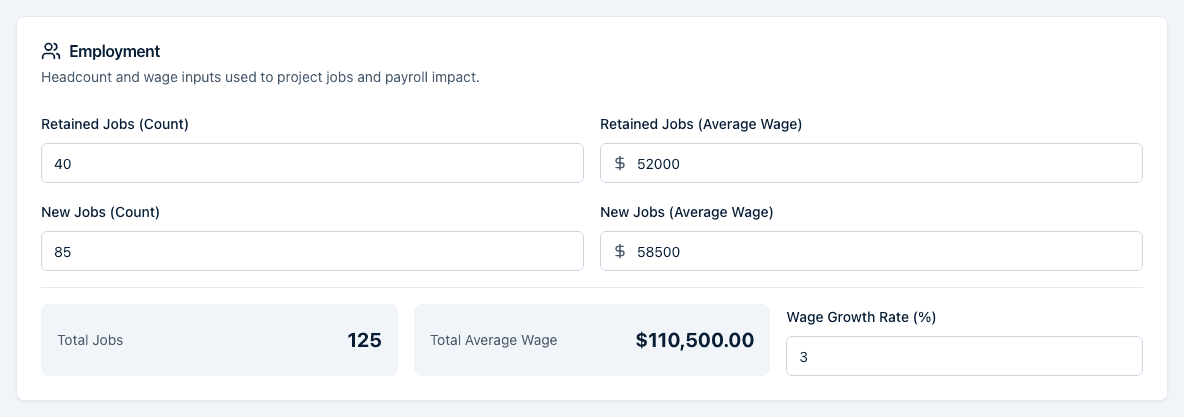
In the Employment card, fill in Retained Jobs (Count), Retained Jobs (Average Wage), New Jobs (Count), and New Jobs (Average Wage).
-
Set Wage Growth Rate (%) — how much average wages grow each year.
-
The card shows two computed figures: Total Jobs (retained jobs plus new jobs) and Total Average Wage.
Read the Jobs and Payroll Impact table
One row per year: calendar year, jobs headcount, that year's Average Wage, Annual Payroll, and a running Cumulative Payroll. A totals row sums Annual Payroll across every year.
Read the Projected Values table
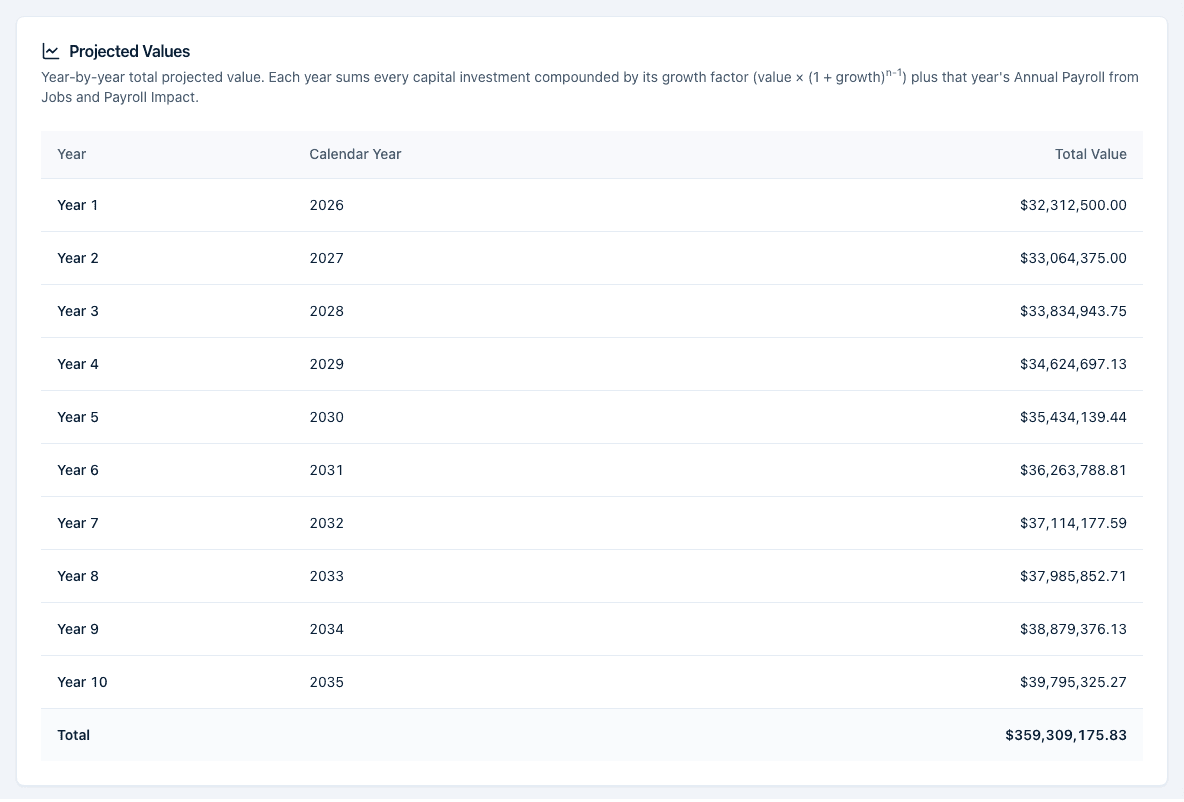
One row per year with a single Total Value — every capital investment's grown value for the year, plus that year's Annual Payroll from the Jobs and Payroll Impact table. A totals row sums Total Value across every year.
How the numbers are calculated
- Capital investments compound individually, each year, by its own growth factor — a $100,000 investment at 5% is worth about $105,000 in year 2, about $110,250 in year 3, and so on. Projected Values adds up every investment's grown value for the year, then adds that year's payroll.
- Wages compound the same way: Total Average Wage grows by the Wage Growth Rate each year, and Annual Payroll is Total Jobs times that year's grown wage.
- Total Average Wage is a sum, not an average — Retained Jobs (Average Wage) plus New Jobs (Average Wage), added together. Keep that in mind when comparing it to either wage you entered.
- Cumulative Payroll is a running total of Annual Payroll across every year so far.
- A growth factor can be negative. Neither Growth Factor (%) on a
capital investment nor Wage Growth Rate (%) has a minimum, so enter
-2.5to model a value or wage that declines each year. Values and wages then shrink by that rate per year instead of growing. (Values, wages, and job counts themselves can't go below zero.)
What the export adds
The exported PDF and CSV restate these tables with a few different labels — the jobs column is called Jobs (Headcount) in the CSV and Headcount in the PDF — and both end with a "Powered by Incenti" mark. See What's in an exported file.
What happens next
Changes auto-save a fraction of a second after you stop typing — there's no Save button, and the Timeline card's Last Updated time moves. Publishing the report (its first export) locks every field on this page for good.
Common questions
Q: Why is Total Average Wage higher than either wage I entered? A: Total Average Wage adds Retained Jobs (Average Wage) and New Jobs (Average Wage) together — it's a sum, not a weighted average of the two figures. That combined number is what compounds by the wage growth rate in the Jobs and Payroll Impact table.
Q: I published the report and now I can't edit the investments — can I undo that? A: No. Publishing an Economic Impact report locks every input field, and there's no way to unpublish from the portal. If the figures were wrong, create a new report with the corrected numbers.
Q: My Projected Values table is empty — what am I missing? A: You need a Number of Years greater than zero in Project Timing and at least one row in Capital Investment. The table shows a prompt describing what's missing until both are set.
Q: Can a growth factor be negative?
A: Yes. Growth Factor (%) and Wage Growth Rate (%) both accept
negative numbers, so -2.5 models a value or wage falling 2.5% a year.
Use it for equipment that depreciates or a wage assumption you expect to
soften.
Q: Does the report pull my project's jobs and capital numbers in automatically? A: No. An Economic Impact report is entirely self-contained — even if the opportunity in your pipeline already records Total Jobs and Capital Investment, you re-enter the figures here. Nothing you type here flows back to the opportunity either.
Related
Last updated on