How Incentive Intelligence figures are computed
The methodology behind the Incentives screen: how dollar figures are normalized, how the Incentive Competitiveness Score is built, what the tiers, categories, source labels and coverage tiers mean, how recipients are classified, and how often each dataset refreshes.
Two datasets, two methods
The Incentives screen reads two separate datasets, and the rules on this page apply to one or the other, never both.
- Incenti Subsidy Intelligence is the award dataset — disclosed incentive deals that companies have already won. Everything about normalization, the Incentive Competitiveness Score, tiers, categories, source labels and the record cap applies to this dataset.
- Incenti Program Intelligence is the Programs Offered catalog — the incentive programs a state currently offers. Coverage tiers, the industry filter rule and the re-verification sweep apply to this one.
An award on record does not prove the program behind it still exists, and a catalogued program does not prove anyone has claimed it. Read Incentive Intelligence for what each tab shows; this page is only about how the numbers are produced.
How dollar figures are normalized
Wherever the Incentives screen blends award dollars across states — the Tracked Value KPI, the category treemap, the annual trend, per-state value, medians and the Compare table — it uses a normalized view of the award dataset rather than raw lifetime totals. Three adjustments are applied, in this order:
- Awards from 2008 onward only. Before 2008 the underlying disclosure is thin and uneven — a handful of states reach back decades while most do not — so lifetime totals mostly measure how far back each state's disclosure happens to go, not how much it awarded.
- Bundled megadeals excluded. A bundled megadeal packages several mechanisms into one headline number, and a few of them dominate some states' totals outright. They are excluded from the blended figures and shown in full on the Megadeals tab instead.
- Extreme outliers capped, not dropped. The remaining values are capped at the 99.9th percentile of that eligible set. A single mis-keyed multi-billion-dollar record can no longer swing a state's total, but the award still counts — at the cap.
The "How this is normalized" footnote
Overview, the Map in ICS mode, Compare, Explorer and every state profile carry a footnote beginning How this is normalized:. It prints the live figures behind the three rules — the window start year, how many bundled megadeals were excluded and their combined value, the cap's percentile and dollar value, and how many awards it affected. It also notes that property-tax relief covers economically equivalent mechanisms (PILOTs, GPLET, tax-refund grants) in states without statutory abatement authority.
The footnote only renders where normalized figures are actually in use. Raw, all-time numbers still appear on the Explorer tab, which lists award records as reported, and on the printable State Report, whose Total Tracked KPI is the raw lifetime figure. That is why the two can differ for the same state.
The Incentive Competitiveness Score
The Incentive Competitiveness Score (ICS) is a 0–100 index of how competitive a state's incentive activity looks. It is a weighted blend of four components, each itself scored 0–100:
| Component | Weight | What it measures |
|---|---|---|
| Typical Award Size | 25% | The state's median disclosed award |
| Large-Award Share | 30% | Share of disclosed value in the two largest tiers |
| Recency | 20% | Share of disclosed value awarded in 2020 or later |
| Category Diversity | 25% | How evenly value spreads across the 14 categories |
How each component is scaled:
- Typical Award Size is scored on a log scale: a median award of $1,000 scores 0 and a median of about $3.2 million scores 100.
- Large-Award Share is the share of disclosed value in the Strategic and Transformational tiers. 0% scores 0; 85% or more scores 100.
- Recency is the share of disclosed value awarded in 2020 or later, used directly as the 0–100 score.
- Category Diversity measures the spread of value across the 14 award categories. A state concentrated in one category scores 0; reaching 95% of the maximum possible spread scores 100.
The ICS is computed once when the award dataset is ingested, over the raw, all-time records. Setting a Years range or reading a normalized dollar figure never changes it — which is why Compare and the state profile footnote both say scores are computed across all years.
Limited disclosure
A state is treated as having limited disclosure when its disclosed value is under $50 million or it has fewer than 30 disclosed awards. There is not enough on record to score those two components honestly, so the national median is substituted for Typical Award Size and Category Diversity (and for Recency too, when the state has no disclosed value at all).
These states show a grey ICS badge, an amber warning icon in the state rankings, a Limited chip on the map hover card, and the line Limited disclosure — score uses national fallbacks on the state profile. The score is still shown — it is just a weaker signal than an ordinary one.
Tiers, categories and source
Award tiers
Every award falls into one tier by its disclosed dollar value:
| Tier | Value |
|---|---|
| Micro | Under $100,000 |
| Standard | $100,000 to $1 million |
| Major | $1 million to $10 million |
| Strategic | $10 million to $100 million |
| Transformational | $100 million and above |
| Undisclosed | No dollar value was reported |
Large-Award Share on Compare, the state profile and the ICS breakdown means Strategic plus Transformational, measured by value.
The 14 categories
Each award is mapped to one of 14 categories: Tax Credit / Rebate, Property Tax Relief (Abatement / PILOT), Cash Grant, Tax Increment Financing, Enterprise / Opportunity Zone, Workforce Training, Financing & Loans, Tax Exemption, Cost / Fee Reimbursement, Infrastructure Assistance, Venture Capital, Technical Assistance, Megadeal (Bundled), and Multiple / Other. Multiple / Other is the fall-through for any award type that doesn't match a known mechanism — it is deliberately not folded into Cash Grant.
The six display groups
Mix bars and filter chips roll the 14 categories into six groups:
| Group | Categories it covers |
|---|---|
| Tax Credit / Abatement | Tax Credit / Rebate, Property Tax Relief |
| Cash Grant | Cash Grant, Cost / Fee Reimbursement |
| Financing & Loans | Financing & Loans, Venture Capital, Tax Increment Financing |
| Workforce / Training | Workforce Training, Technical Assistance |
| Infrastructure | Infrastructure Assistance, Enterprise / Opportunity Zone |
| Exemption / Other | Tax Exemption, Megadeal (Bundled), Multiple / Other |
A bundled megadeal lands in Exemption / Other because it is several mechanisms at once and cannot be attributed to any single group.
Source: State, Local, Unknown
The Source column on Explorer records the level of government that granted the award. It reads State, Local, or Unknown. Awards reported as coming from multiple state programs are folded into State. Unknown only means the granting level wasn't recorded on that record — it is not a judgement about whether the award is real or verified.
What "Capped" means
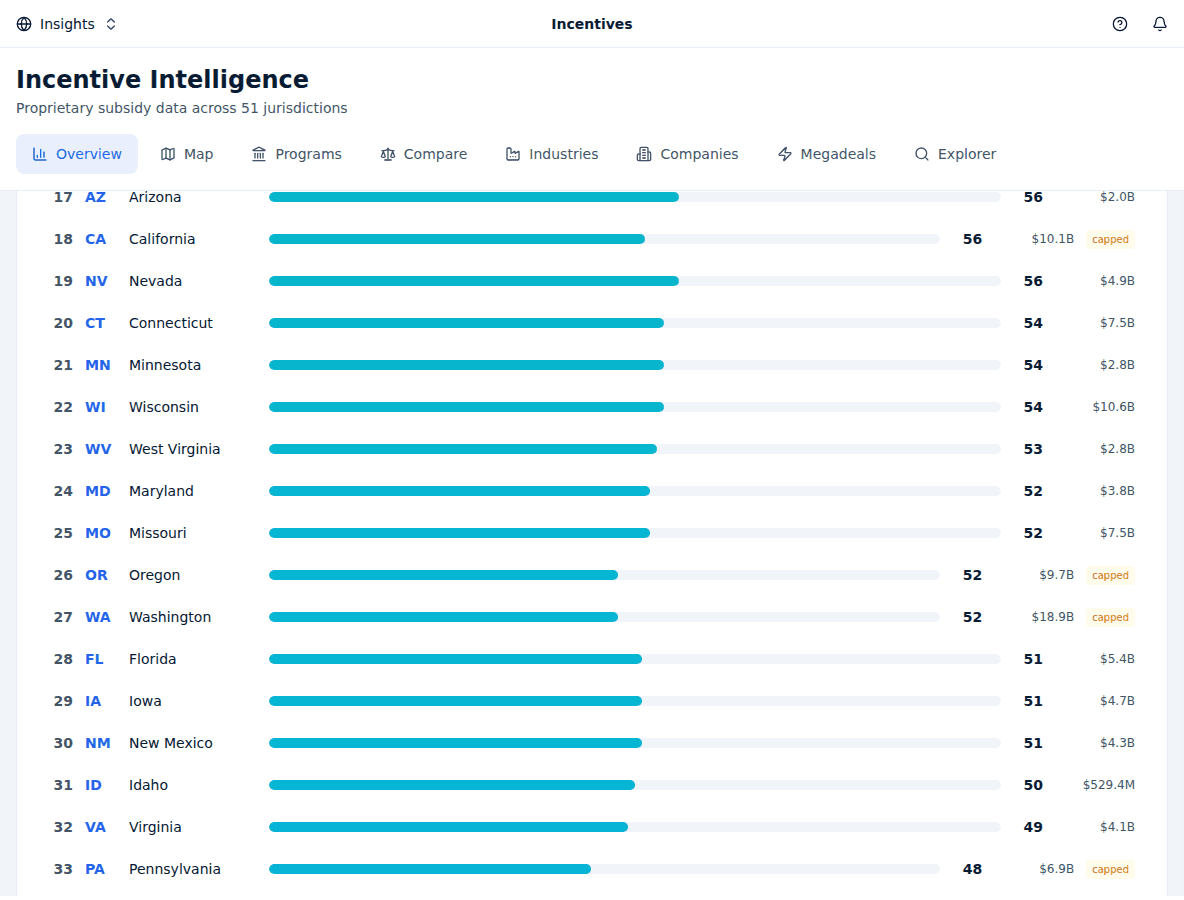
The award extract Incenti receives is capped at 10,000 records per state.
Any state at or over that count carries a capped badge in the state
rankings, on the Industries tab's by-state view, in the Explorer
footer, and as a Capped source column marked Y in the by-state CSV and
XLSX exports.
For a capped state:
- Its award set is likely incomplete — records past the limit are simply not in the extract.
- Its award count is not comparable to an uncapped state's. The Explorer footer and the Compare group-leader footnote both say so.
- Dollar figures should be read as a floor, not a total.
The cap is a property of the source extract, not a display limit — there is no setting that lifts it.
How recipients are classified
Award recipients are placed on NAICS 2022 industry nodes — the U.S. Census Bureau's classification scheme — by a model-assisted batch job that runs over the whole award dataset. Your account does not run it and cannot trigger it.
- Each result carries a confidence between 0 and 1. Results below the confidence floor (0.5 by default) are kept but stay unclassified rather than being guessed into a sector.
- Where a code came from a manual review or from the extract itself, that code always wins over a model-assigned one.
- On a company's Entities & Classifications card, the confidence is shown both as a number and as a tier: High at 0.85 and above, Medium at 0.7 to 0.85, Low below that. An entity with no code reads Not classified, and each entity is classified on its own activity — a subsidiary does not inherit its parent's industry.
- The Sector chips on a state's Top Recipients in XX list are a different thing: they come only from manually curated labels, so most recipients have none, and an industry chip can legitimately report No company-level leaders identified for this segment yet.
Program catalog coverage
A state's Programs Offered coverage tier is derived every time the list is read, from how many verified programs are on file against a benchmark count of how many that state is expected to have:
| Tier | Rule | What the screen shows |
|---|---|---|
| None | No verified programs | "No verified programs for X yet", with chips for jurisdictions that do have them |
| Partial | Anything below the full bar | "Coverage in progress — N programs verified so far of an estimated M" |
| Full | Verified ÷ benchmark is 0.9 or higher, and a benchmark is on file | No coverage banner |
A state with programs on file but no benchmark can never read full — without a denominator, completeness cannot honestly be claimed. Only verified records are ever served; drafts under review are invisible. Coverage counts sunset programs too, and narrowing the list with filters never changes the tier — a filter changes what you see, not how completely the state is catalogued.
The industry filter rule
Picking an industry chip on the Programs tab does three things:
- Programs tagged to that industry match, are listed first, and are the only ones counted in the N of M programs match the current filters line.
- Programs with no industry tags at all — general-purpose programs open to any industry — are still listed, because they are genuinely available. They are not counted in the match number.
- Programs tagged only to other industries are removed.
That is why the list can be longer than the match count, and the report's Programs Offered section carries the note "Includes untagged general-purpose programs available to any industry; industry-specific matches are listed first."
How often the data refreshes
Award data is event-driven. There is no schedule: the dataset is re-ingested whenever a new extract is loaded. Extracts have historically arrived a few times a year. A monthly watchdog warns Incenti internally once 90 days have passed without a successful ingest, so a silently ageing dataset gets noticed.
The program catalog is also event-driven per state — a state is re-published when its catalog work lands. On top of that, a weekly sweep (Mondays) flags two things for an Incenti reviewer: verified programs whose last-verified date has aged past 11 months, keeping every record inside a 12-month re-verification target, and legislative bill matches that suggest a program may have changed. Each program row shows its own Verified Mon YYYY date, so you can always see how fresh a specific entry is.
Within a session, program and coverage responses are cached in your browser for about an hour; reloading the page picks up anything newer.
Momentum, top recipients and list sizes
Momentum Leaders ranks states by the share of their lifetime tracked value awarded in the last five years of the dataset — not by how much they awarded. A small state that concentrated its activity recently can outrank a much larger one.
Top Recipients in a state ranks by value captured in that state; the Biggest Recipients Nationwide and Companies leaderboards rank by value captured nationwide, so the same company can sit in a different position in each.
Fixed list sizes worth knowing:
| List | Rows |
|---|---|
| Momentum Leaders (Overview) | 6 |
| Biggest Recipients Nationwide (Overview) | 8 |
| Biggest Incentive Recipients (Companies) | 25 |
| Company search results | 10 (needs at least 2 characters) |
| Top Recipients on a state profile | 10 |
| Top recipients at an industry node | 25 |
| Explorer award records shown at once | 500 |
Common questions
Q: Why is the Tracked Value here smaller than the total I saw last month, or than the Total Tracked on the printed State Report? A: They are measuring different things. The Tracked Value (2008+, normalized) KPI covers awards from 2008 onward, excludes bundled megadeals and caps extreme outliers at the 99.9th percentile. The Total Tracked figure on the printable State Report, and the records on Explorer, are the raw all-time numbers with none of that applied. Neither is wrong — use the normalized figure when you're comparing states, and the raw figure when you're citing one state's full record.
Q: What exactly counts as a megadeal? A: A megadeal is an award filed as a bundled package — several incentive mechanisms rolled into one headline number for one project. They sit in the Megadeal (Bundled) category, are excluded from every blended dollar figure, and are shown in full on the Megadeals tab. The "How this is normalized" footnote prints how many were excluded and what they were worth.
Q: How is the ICS calculated, and what are the weights? A: Typical Award Size 25%, Large-Award Share 30%, Recency 20%, Category Diversity 25% — each scored 0–100 and blended to a 0–100 total. See The Incentive Competitiveness Score for how each component is scaled. The same weights are printed on the ICS component bars on the state profile and in the report, so the score always reconciles with what's on screen.
Q: Why is my state's ICS grey, or marked "Limited"? A: Because it has under $50 million in disclosed award value or fewer than 30 disclosed awards. Two of the four components fall back to national medians in that case, so the score is shown in grey and flagged to tell you it rests on thin data rather than on the state's own record.
Q: Does "Capped" mean Incenti is hiding records from me? A: No. The cap is on the source extract — 10,000 records per state — so the records simply aren't in the data anywhere. It means that state's award count can't be compared with an uncapped state's, and its dollar totals should be read as a floor.
Q: Does the Source column reading "Unknown" mean the award is unverified? A: No. It only means the record didn't say which level of government granted it. Every award in the dataset is a disclosed award; "Unknown" is a gap in one field, not a doubt about the award.
Q: Why does "Top Recipients in TX" show a Sector for some companies and not others? A: Those Sector chips come only from manually curated labels, not from the automated NAICS classification. Most recipients don't have one yet, so a chip appearing is the exception rather than the rule. The NAICS codes you see on a company's Entities & Classifications card are the automated ones, and they cover far more entities.
Q: How often is the award data refreshed, and when was it last updated? A: It refreshes whenever a new extract is ingested rather than on a schedule — historically a few times a year. The Year Range KPI on Overview shows the span the current dataset actually covers, which is the quickest read on how current it is. If you need the exact ingest date, ask Incenti support.
Q: Why does the Programs tab say "12 of 30 programs match" but list more than 12? A: Because general-purpose programs with no industry tags stay in the list — they really are available to your industry — but aren't counted as industry-specific matches. The 12 is the count of programs tagged to the industry you picked.
Related
Last updated on