Explore a location
Browse states, metros, counties, and cities on the map, table, or both, filter by any metric, select a location to see its detail metrics and benchmarks, and export or start a report from your selection.
Before you start
- Explore is one of the sidebar areas inside Insights; open it from the
sidebar or by going to
/insights, which lands there by default. - Explore works at four geography levels: State, Metro, County, and City. Switch levels with the buttons at the left of the toolbar. Each level keeps its own view mode, search, filters, and selection; nothing carries over when you switch levels.
Steps
Choose a level
- Click State, Metro, County, or City in the toolbar. The map, table, metric list, and filters all change to match the level you picked.

Pick what the map or table colors by
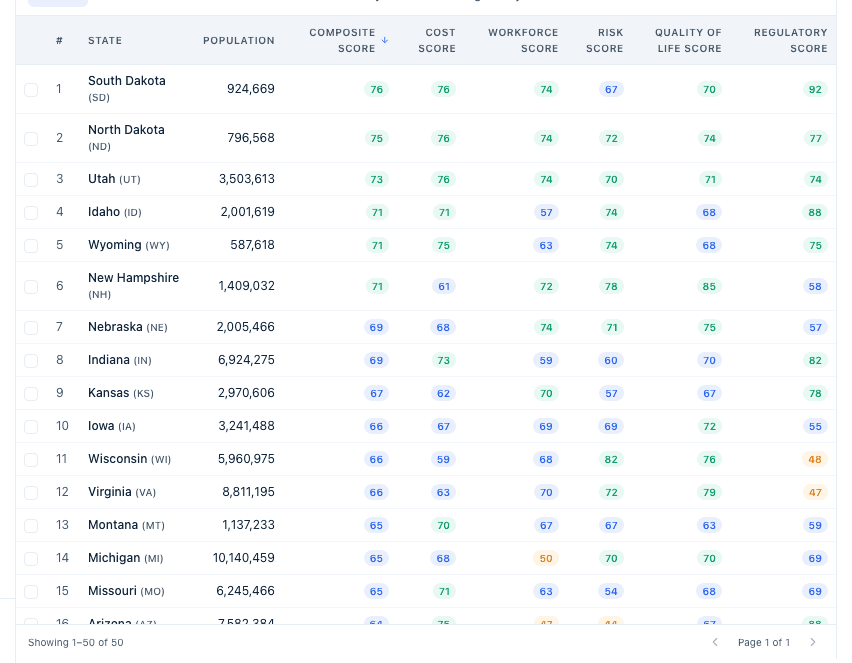
Next to the view mode buttons is a metric dropdown. It sets which metric colors the map and, at State and County level, which metric the TOP 5 list ranks by. Composite Score blends every category into one 0–100 number; Cost Score, Workforce Score, Risk Score, Quality of Life Score, and Regulatory Score are the same blend limited to one category. The metric list itself changes per level: State, Metro, and County each offer their own composite and category scores plus every metric in their catalog, while City has no composite or category scores and instead lists its 14 native ACS metrics directly.
Switch between Map, Table, and Split
- Click Map, Table, or Split to change the layout.
- Map shows every location as a choropleth (State, County) or a bubble (Metro, City, sized by population and colored by the selected metric).
- Table replaces the map with a sortable list. Click a column header to sort by it. Above the table, tabs switch which metric group's columns are shown: Scores, Workforce, Cost, Risk, Quality of Life, and Regulatory. The table paginates and shows "Page X of Y" at the bottom.
- Split shows the map on top and the table below at the same time.
Search for a location
- Type into the search box: Search states... at State level, Search metros... at Metro level, Search counties or cities... at County level (matching both county names and known city aliases), or Search cities… at City level. Pick a result to select it; at State, Metro, and County level this also clears the search box.
Filter by metric
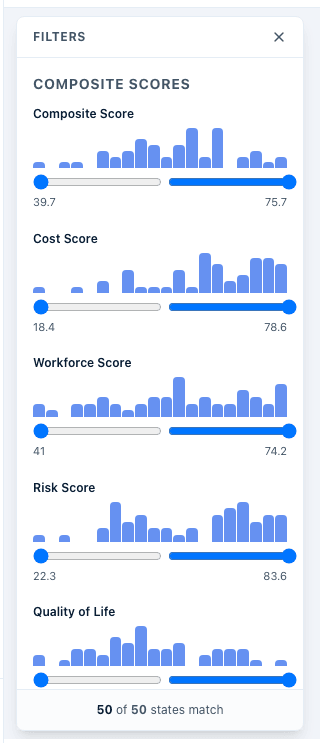
- Click Filters to open the filter panel. Each metric gets a slider with a mini histogram of the current level's values; drag either handle to set a range, or click Reset to clear one metric. The panel is grouped under the same category headings as the data (Composite Scores, Cost Modeling, Workforce, Risk Assessment, Quality of Life, Regulatory & Policy). The bottom of the panel shows a live count, for example "8 of 50 states match." City level's filter panel covers its 14 native metrics instead, grouped by their own categories, and adds separately from this panel: an All states dropdown to focus one state, and an Incorporated only checkbox to exclude census-designated places. Metro level does not have a Filters button.
Select a location
- Click a location on the map, or click its row in the table, to select it.
At Metro and City level a row click opens that location's
details, and the checkbox at the start of the row is what adds it to
your selection for export or comparison. The right-hand panel fills in
with that location's details:
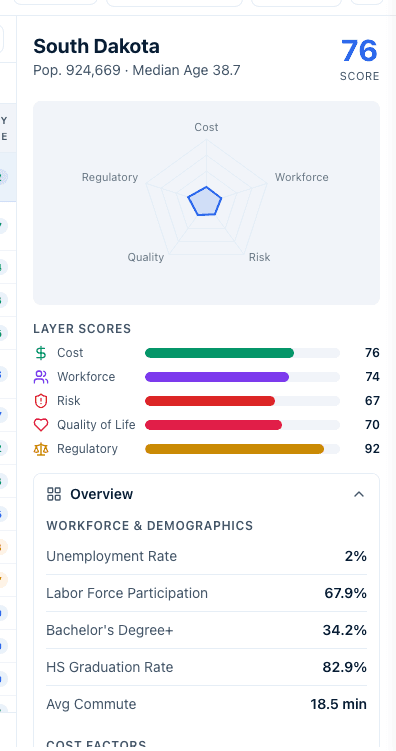
- A header with its name, population, and overall score.
- Layer Scores bars for Cost, Workforce, Risk, Quality of Life, and Regulatory.
- An accordion of sections you can expand or collapse: Overview (metrics grouped as Workforce & Demographics, Cost Factors, and Risk & Environment), Insights (short rule-based call-outs comparing the location with the national average), Benchmarks (this location's rank and percentile against every other location at this level, plus the national average), and SWAT Analysis (a strengths, weaknesses, opportunities, and threats summary with a cost-versus-talent trade-off). State and County panels also include Regional priorities (EDD). City's panel is laid out a little differently: City metrics (ACS-native), More indicators (additional metrics, some inherited from the city's county when no source publishes them below county grain), AI Analysis, and About this place.
- Each metric shown in these sections traces back to a public data source and a refresh period; the source and period are what make a number trustworthy for a site-selection or benchmarking conversation.
- Clicking a second, third, and so on location keeps adding to your selection instead of replacing it. Click a selected location again to remove it, or click the X button in the toolbar to clear the whole selection.
Use the TOP 5 list
The map view shows a TOP 5 card (Top 5 States, Top 5 Metros, or Top 5 Counties) ranked by whichever metric is selected. If you have a selection, the list ranks your selected locations; with nothing selected, it ranks the whole filtered set. Click any entry to select that location. City level does not have a TOP 5 list.
EDD regions
At State and County level, click EDD regions to switch the whole screen to an Economic Development District overlay: EDA-designated economic development districts instead of states or counties, each with its own coded regional priorities and boundary. Turning the chip off returns you to the state or county view exactly as you left it.
Export
- Select one or more locations, then click Export to download a CSV of your current selection. At State, Metro, and County level you can select up to 10 locations; clicking Export with nothing selected prompts "Select up to 10 states to export." (the message names the current level's noun), and selecting more than 10 prompts you to deselect down to 10. City level has its own cap: up to 15 cities, and Export is disabled until you select at least one.
Create a report
- With a selection made, click Create report to open the Reports flow for exactly that selection: one location produces a standard profile report, two or more produce a comparative report. See Insights overview and data coverage for more on what a report contains.
Compare
Selecting two or more locations also turns on a Compare button and a compact comparison panel in the right-hand rail. See Compare locations for how comparison works.
Economic development organizations mostly select their own state, metro, or county to check how it benchmarks nationally, then add competitor locations to the same selection to compare on the spot. The TOP 5 list and the Benchmarks accordion section are usually the first things checked before pulling a metric into a marketing deck or an attraction pitch.
Site selectors mostly start from a shortlist of candidate locations for a client's project, select every candidate at once, and lean on the comparison panel and Filters to screen out locations that fail a hard requirement (for example a minimum workforce score or a maximum electricity rate) before narrowing further.
What happens next
- At State level only, your selection is written into the page's URL as
?states=, so a link you copy while states are selected reopens Explore with the same selection restored. Metro, County, and City selections are not reflected in the URL. - Switching levels always clears your search, filters, and selection for the level you're leaving; they do not carry over.
- Filter and metric choices are per-session. Reloading the page returns Explore to its defaults.
Common questions
Q: Why does a county show fewer metrics than a state? A: State, Metro, and County each have their own metric catalog, and County's catalog is not a subset of State's; some metrics are state-only (for example tax climate rank) because the underlying source only publishes at state level. Check the metric's source and period in the location's detail panel to see what actually backs it.
Q: Why can't I export more than 10 states at once? A: Export always operates on your current selection and is capped at 10 locations for State, Metro, and County level (15 for City) so nobody accidentally downloads the full dataset in one action. Deselect down to the limit and export again, or run multiple exports.
Q: I selected several counties, but a location I don't remember picking is also highlighted. What happened? A: The TOP 5 list and the map both let you click a location to select it, and clicks add to your selection rather than replacing it. Use the X button in the toolbar to clear your whole selection and start over.
Q: Can I send a colleague a link to what I'm looking at? A: At State level, yes: your selected states are part of the page URL, so copying the address bar shares the same selection. Metro, County, and City selections are not in the URL, so share a report or an export for those instead.
Related
Last updated on