Insights overview and data coverage
Understand what Insights is, how to get to it, what each sidebar area does, the four geography levels it covers, how scores are calculated, and what is and is not covered by the data.
Before you start
- Insights is a separate product from your account's forms, contacts, and pipeline data. It is granted per account, so it only appears in the header workspace switcher if your account has it.
- Insights covers public economic, workforce, cost, risk, quality-of-life, and regulatory data for U.S. states, metros, counties, and cities, plus a proprietary incentive-award dataset called Incentive Intelligence.
Steps
Open Insights and pick a starting point
- Click the workspace switcher in the header and choose Insights.
- Use the sidebar to pick where to start: Ask, Explore, Analyze, Incentives, or Reports.
- Going directly to
/insightstakes you to Explore, since it's the default landing page for the module.
What each area does
- Explore is the map and table view of states, metros, counties, and cities. Pick a geography level, click a location, and see its metrics, computed scores, benchmark call-outs, and a strengths-and-weaknesses summary. Selecting more than one location opens a side-by-side comparison. See Explore a location and Compare locations.
- Ask is a conversational interface for questions about locations, cost, workforce, risk, incentives, or site-selection strategy, answered from the same data. See Ask Insights.
- Analyze is a guided competitive-analysis wizard that helps you work out which states, metros, or counties you compete with and on what.
- Incentives is Incentive Intelligence: proprietary subsidy data across 51 jurisdictions, covering disclosed awards, recipients, megadeals, and the programs each state offers. See Incentive Intelligence.
- Reports generates downloadable profile and comparison reports for states, metros, counties, districts, and cities, plus incentive reports, and keeps a history of the reports you have generated.
Geography levels
Explore, Compare, and Reports all work across four geography levels. Each level scores locations from the same five category scores, but the specific metrics feeding those scores differ by level because not every data source publishes at every grain:
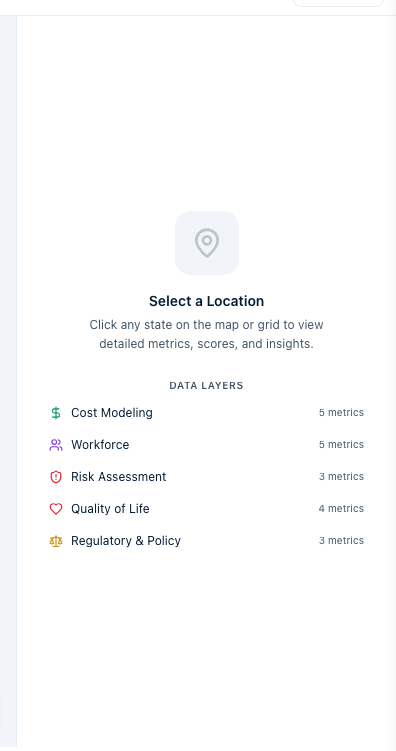
- State: all 50 states, scored from 26 required metrics across five data layers (Cost Modeling, Workforce, Risk Assessment, Quality of Life, and Regulatory & Policy).
- Metro: major U.S. metro areas, scored from metrics across five data layers (Workforce, Cost, Risk, Quality of Life, and Regulatory, the last of which is sourced at the state level and applied to metros within it).
- County: U.S. counties, scored across 24 indicators in five data layers (Workforce, Cost, Risk, Quality of Life, and Regulatory).
- City: about 32,000 incorporated places and census-designated places, each tied to its county, with a smaller set of city-level indicators and no composite score.

Scores
At State, Metro, and County level every location gets a Composite Score plus five category scores: Cost Score, Workforce Score, Risk Score, Quality of Life Score, and Regulatory Score. Each category score is a weighted blend of that location's own metrics in the category (for example, Cost Score blends electricity rate, natural gas price, tax climate rank, workers' compensation rate, and health premiums), with each metric scaled to a 0 to 100 range against fixed bounds, so a score depends only on the location's own numbers, not on which other locations are loaded. The Composite Score blends the five category scores. A higher score is better; where a metric is "lower is better" (unemployment, disaster count, crime) it is inverted before blending. City level lists its indicators directly and has no composite score.
Refresh cadence
Data refreshes on a monthly cycle, staggered by geography level so states, metros, counties, and cities each update on their own schedule rather than all at once. Every individual metric shows its source and the period it covers (often labeled "as of" a specific date), so you can always tell how current a number is without leaving the page.
What Insights does not cover
- At the state level, Insights covers the 50 states. Washington, D.C. and U.S. territories are not included as states.
- Metro coverage is limited to metro areas defined in the official federal metro-area delineation; a small city or town outside that delineation may not have its own metro entry.
- When a metric has no data for a location, it shows as unavailable rather than as an estimate. Insights never guesses a value to fill a gap.
- Insights is global public and proprietary data, not your account's data. You cannot edit it, and it does not include your own contacts, responses, or opportunities. Combining Insights with your own records happens through the rest of the product (for example, linking a property or opportunity to a location), not by editing Insights data itself.
What happens next
- Nothing you do in Insights changes your account's data. Selections, filters, and comparisons are per screen and per session; only Ask conversations and generated reports are saved.
- Data refreshes arrive in the background on the monthly schedule above. You do not need to do anything to receive them; a metric's "as of" period updates when its source does.
Economic development organizations typically use Insights to make the case for their own region: pulling their state, metro, or county's scores and metrics to market the location to prospects, and using Explore and Compare to benchmark against competing locations a prospect is also considering.
Site selectors typically use Insights to narrow down candidate locations for a client's project: filtering and comparing states, metros, counties, and cities on cost, workforce, and risk factors, then using Ask or Reports to build the analysis into a deliverable.
Common questions
Q: Why doesn't my county show a value for a metric? A: The source behind that metric may not publish data at the county grain, or that county may not be part of the metric's coverage. Insights shows a metric as unavailable rather than estimating a value, so a blank field means there is genuinely no data to show, not a loading error.
Q: How often is the data refreshed? A: Monthly, on a staggered schedule per geography level, so states, metros, counties, and cities each refresh on their own cycle. Each metric shows its own source and period so you can see exactly how current it is.
Q: Can I add my own data to Insights? A: No. Insights is public and proprietary data covering real U.S. geography; it is not editable and does not contain your account's contacts, responses, or other records. You can reference a location's Insights data alongside your own records elsewhere in the product, but you cannot change what Insights shows.
Q: Why is Washington, D.C. missing at the state level? A: Insights' state level covers the 50 states only. D.C. and U.S. territories are not included as states, though D.C. does appear in Incentive Intelligence, which covers 51 jurisdictions.
Related
Last updated on